Report Overview
SellingPilot’s Sales Report is your core tool for gaining holistic business insights and driving精细化 operations. Through three key modules—Sales Performance, Store Sales, and Product Sales—it systematically presents a complete data journey from overall trends down to individual item performance. All data supports flexible filtering by time, channel, store, category, and more, combined with visual charts and detailed tables to help you quickly identify issues, validate strategies, and optimize resource allocation.
Module 1: Sales Performance
Functionality
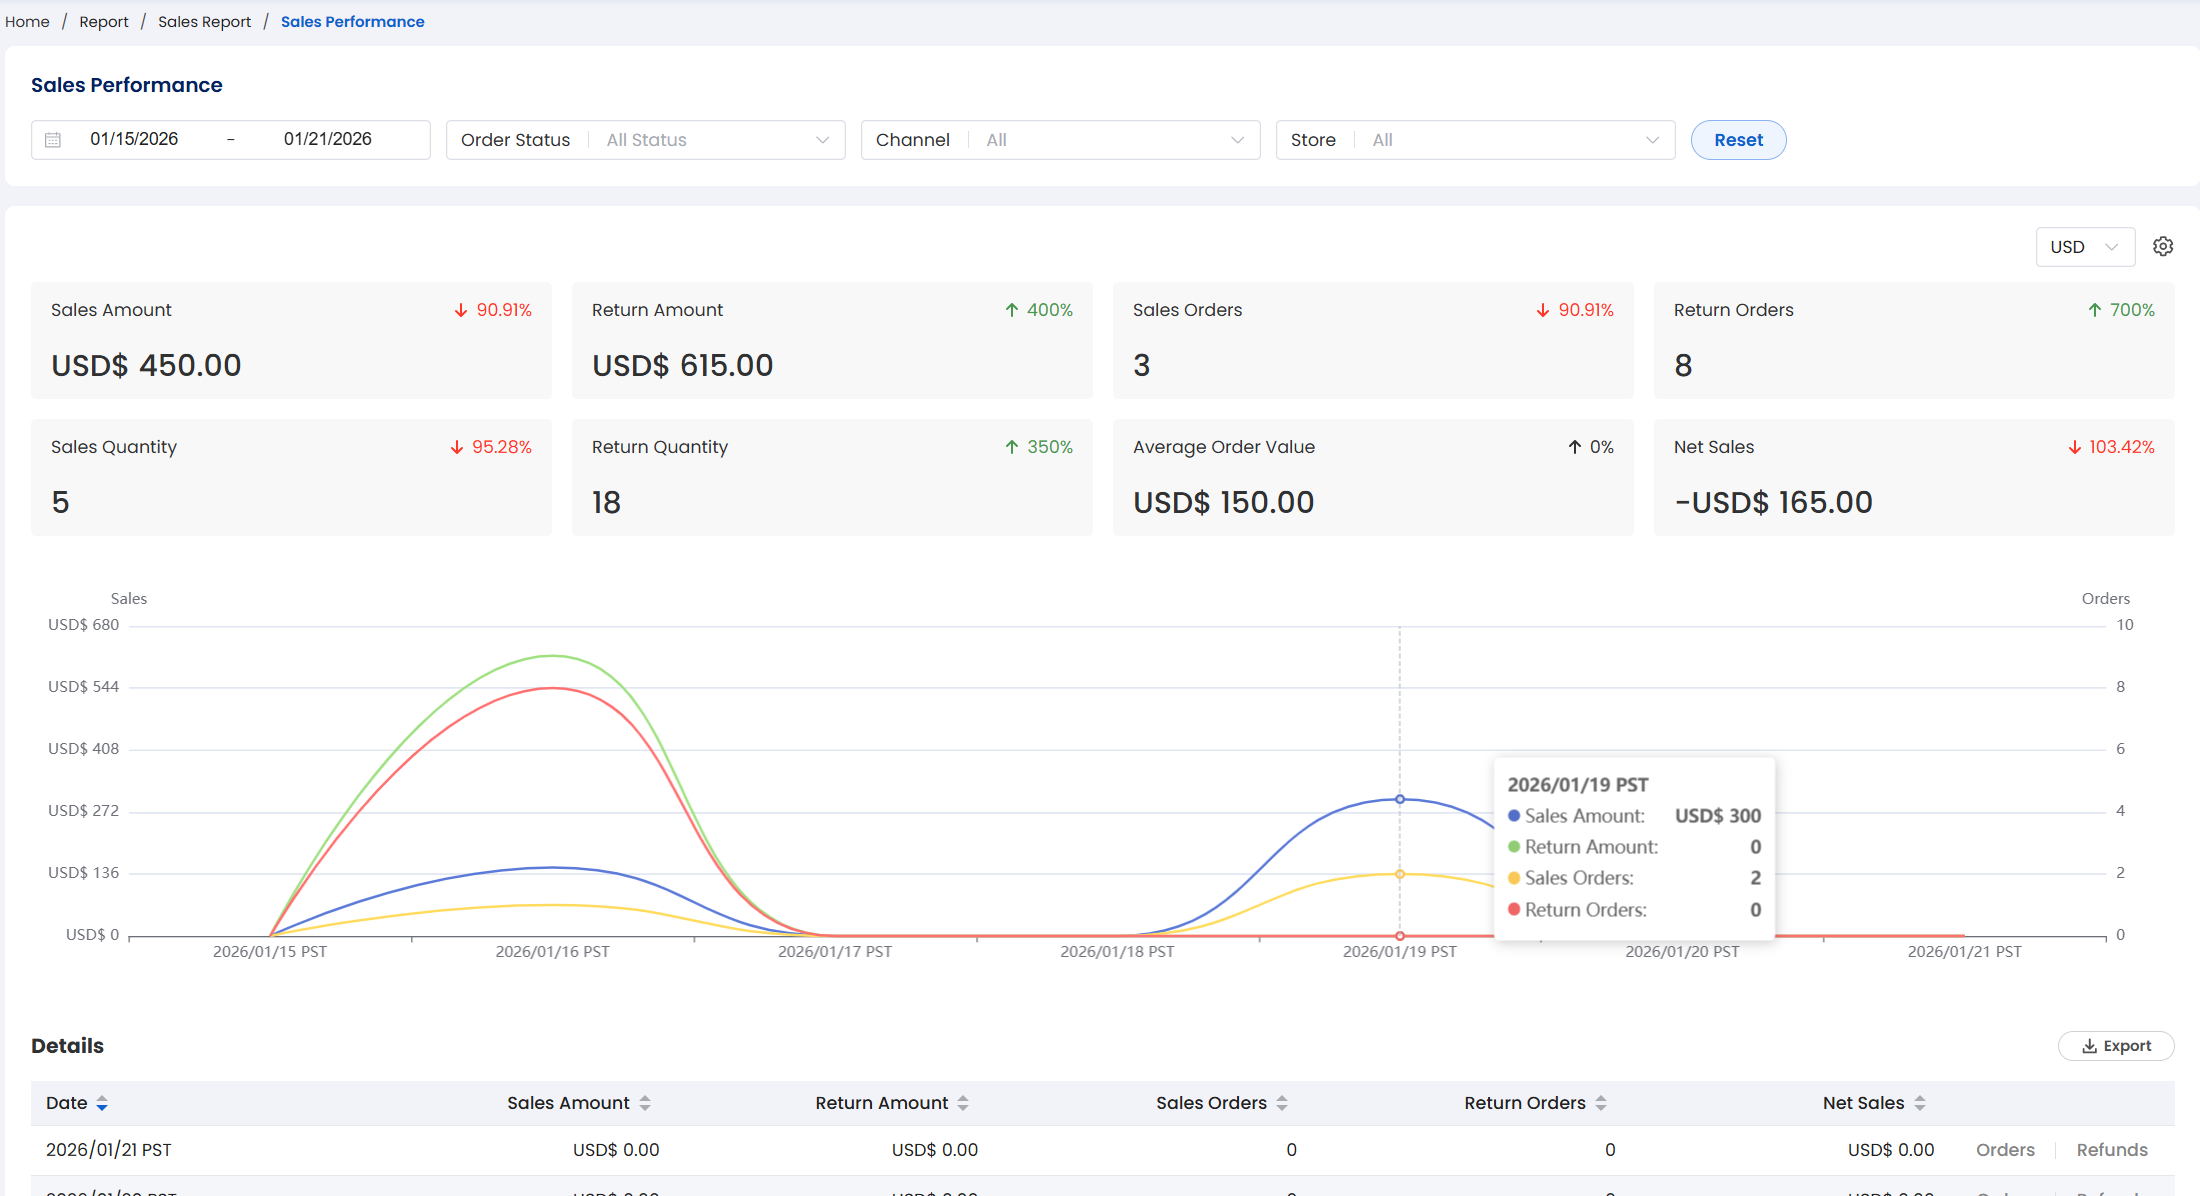
The Sales Performance module offers a macro-level view, comprehensively reflecting revenue, orders, after-sales activity, and customer value under your selected conditions. It serves as the primary reference for daily business reviews and short-term strategic adjustments.
Key Metrics and Business Value
| Metric | Description |
|---|---|
| Sales Amount | Measures total revenue scale; used to assess market demand, promotion effectiveness, and team goal achievement. |
| After-Sales Amount | Reflects customer satisfaction and product/logistics quality risk; a sustained increase may signal quality control issues or inaccurate product descriptions. |
| Number of Sales Orders | Indicates customer engagement and conversion efficiency; when combined with traffic data, it enables calculation of overall conversion rate. |
| Number of After-Sales Orders | Identifies weak points in service or fulfillment; a high ratio warrants investigation into customer service response or shipping processes. |
| Sales Quantity | Measures actual shipment volume; used for inventory turnover planning, logistics cost estimation, and supply chain management. |
| After-Sales Quantity | Directly tied to return/exchange costs and inventory return pressure; a critical input for reverse logistics management. |
| Average Order Value (AOV) | Reflects customer purchasing power and effectiveness of product bundling strategies; a decline may indicate an increased share of low-priced items or excessive discounting. |
| Net Sales (Sales Amount – After-Sales Amount) | Represents realizable revenue; the core benchmark for profit estimation, ROI analysis, and financial reconciliation. |
Data Visualization
- Multi-Metric Trend Line Chart: Simultaneously displays daily trends for sales amount, after-sales amount, sales orders, and after-sales orders.
- Purpose: Quickly identify whether sales peaks/troughs coincide with spikes in after-sales activity to assess growth quality. For example, if after-sales orders surge after a major promotion, consider improving quality inspection or packaging standards.
Filter Options
- Time range, order status, channel, store
- Typical Use Cases:
- View only “Shipped” orders → Focus on verified transactions, excluding pending noise
- Limit to a specific channel + last 7 days → Rapidly evaluate the impact of a new ad campaign
Module 2: Store Sales
Functionality
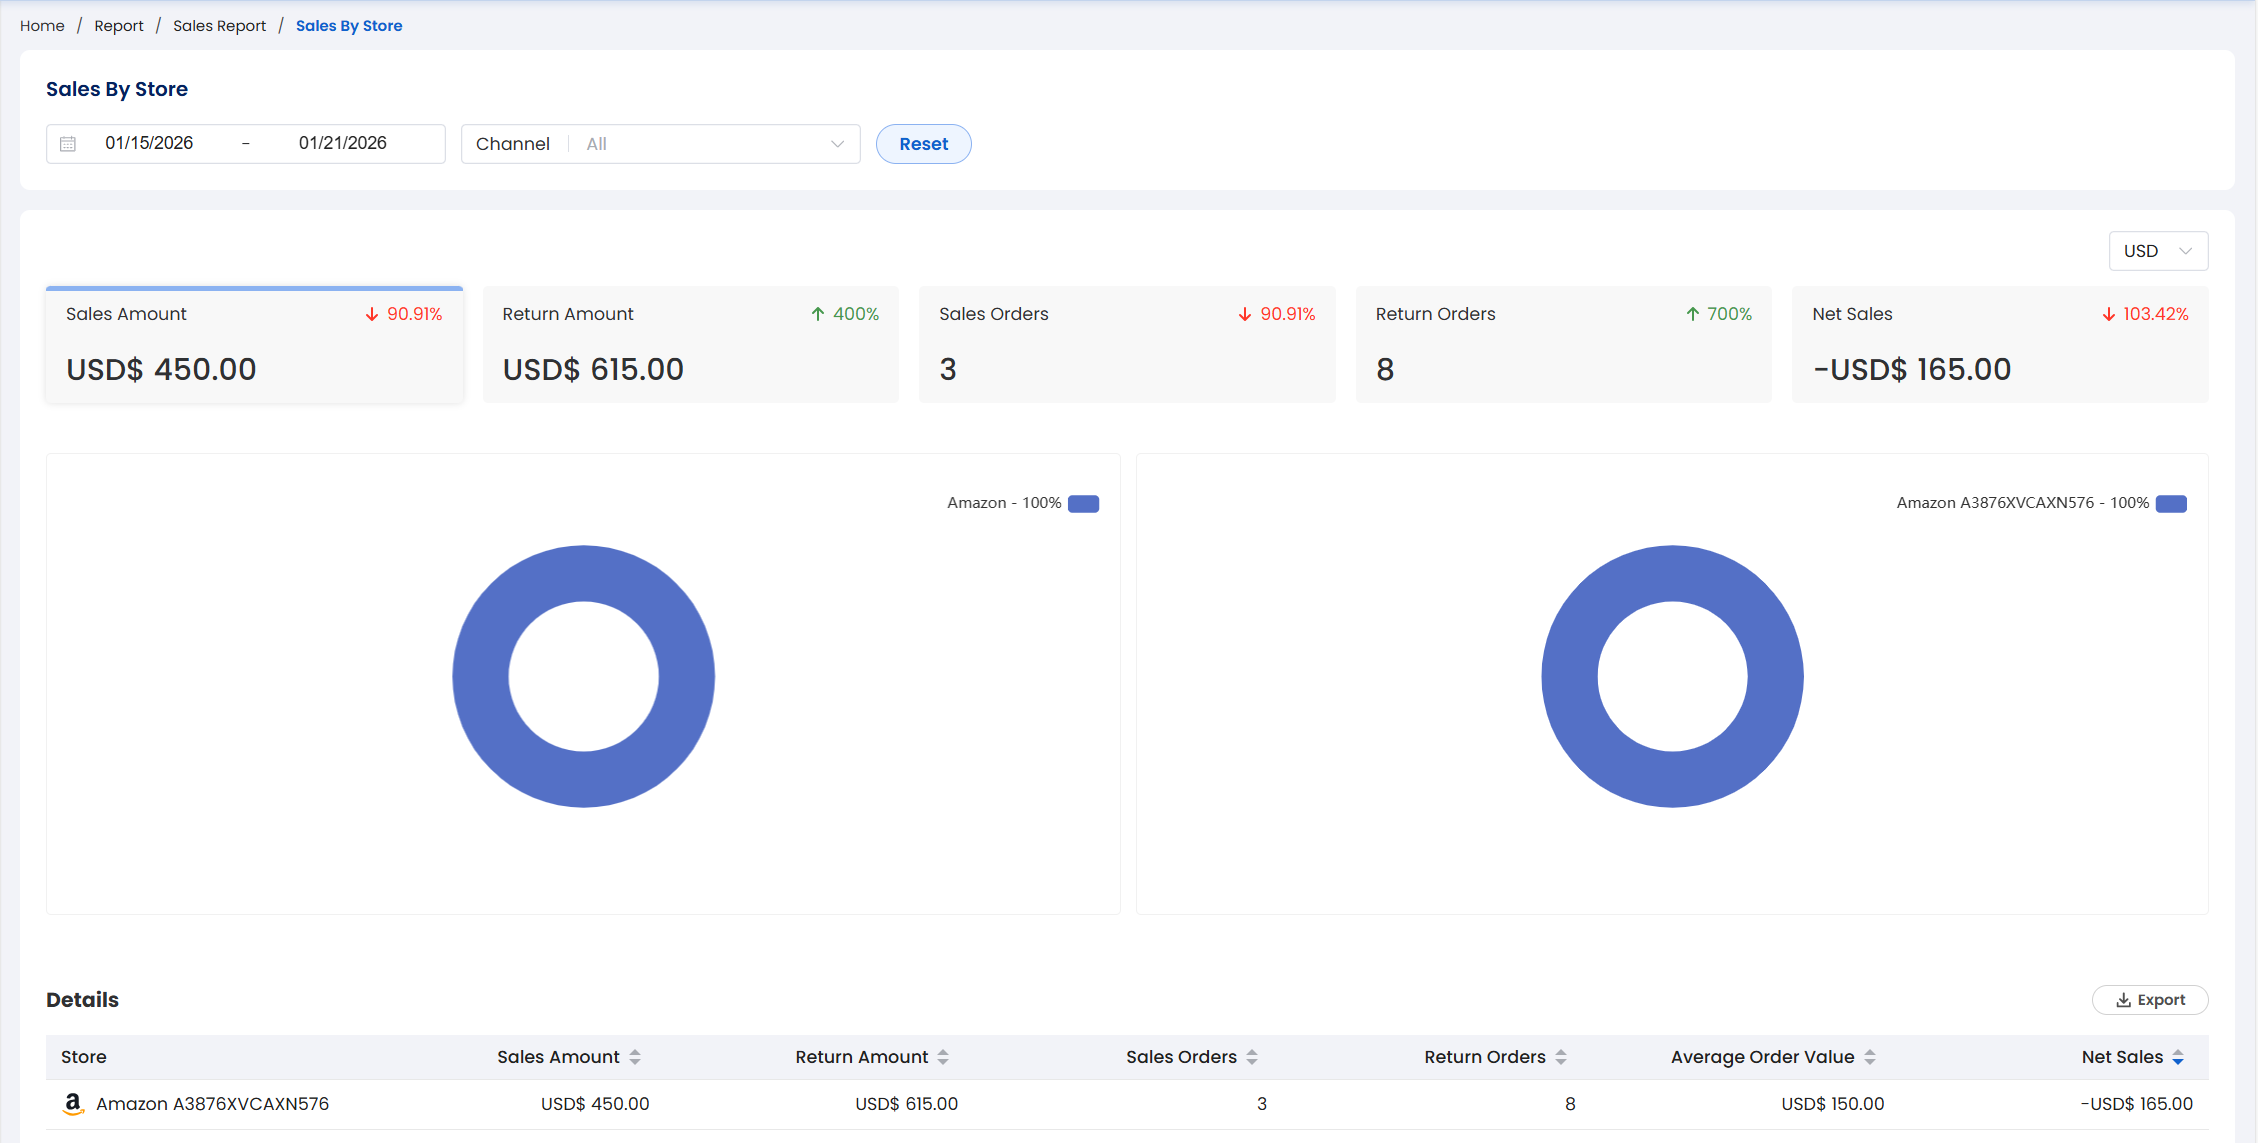
The Store Sales module is designed for multi-account/multi-site management scenarios, quantifying each store’s contribution to your overall business. It helps you allocate operational effort, advertising budgets, and inventory resources more effectively.
Key Metrics and Business Value
| Metric | Description |
|---|---|
| Sales Amount & Net Sales | Identifies top-performing and potential stores; consistently low-contributing stores may be candidates for closure or restructuring. |
| After-Sales Amount Ratio (After-Sales Amount / Sales Amount) | Evaluates store-level service quality; a high ratio may stem from poor localization (e.g., language, sizing), slow shipping, or mismatched product selection. |
| Number of Sales Orders | Reflects a store’s ability to acquire and convert customers; combined with ad spend, it enables calculation of Customer Acquisition Cost (CAC) per store. |
| After-Sales Order Ratio | Measures customer experience stability; if significantly higher than other stores, conduct a dedicated review of product descriptions, customer service responsiveness, or fulfillment workflows. |
Data Visualization
- Channel/Store Contribution Donut Chart: Visually shows each store’s weight in total sales.
- Purpose: Avoid the “averaging trap”—even if total sales grow, it might be driven by just one store while others are actually declining.
Filter Options
- Time range, channel
- Typical Use Cases:
- Compare the same brand’s performance on Amazon US vs. CA → Evaluate regional market expansion effectiveness
- Analyze Walmart new store vs. legacy store → Validate cold-start strategy success
Module 3: Product Sales
Functionality
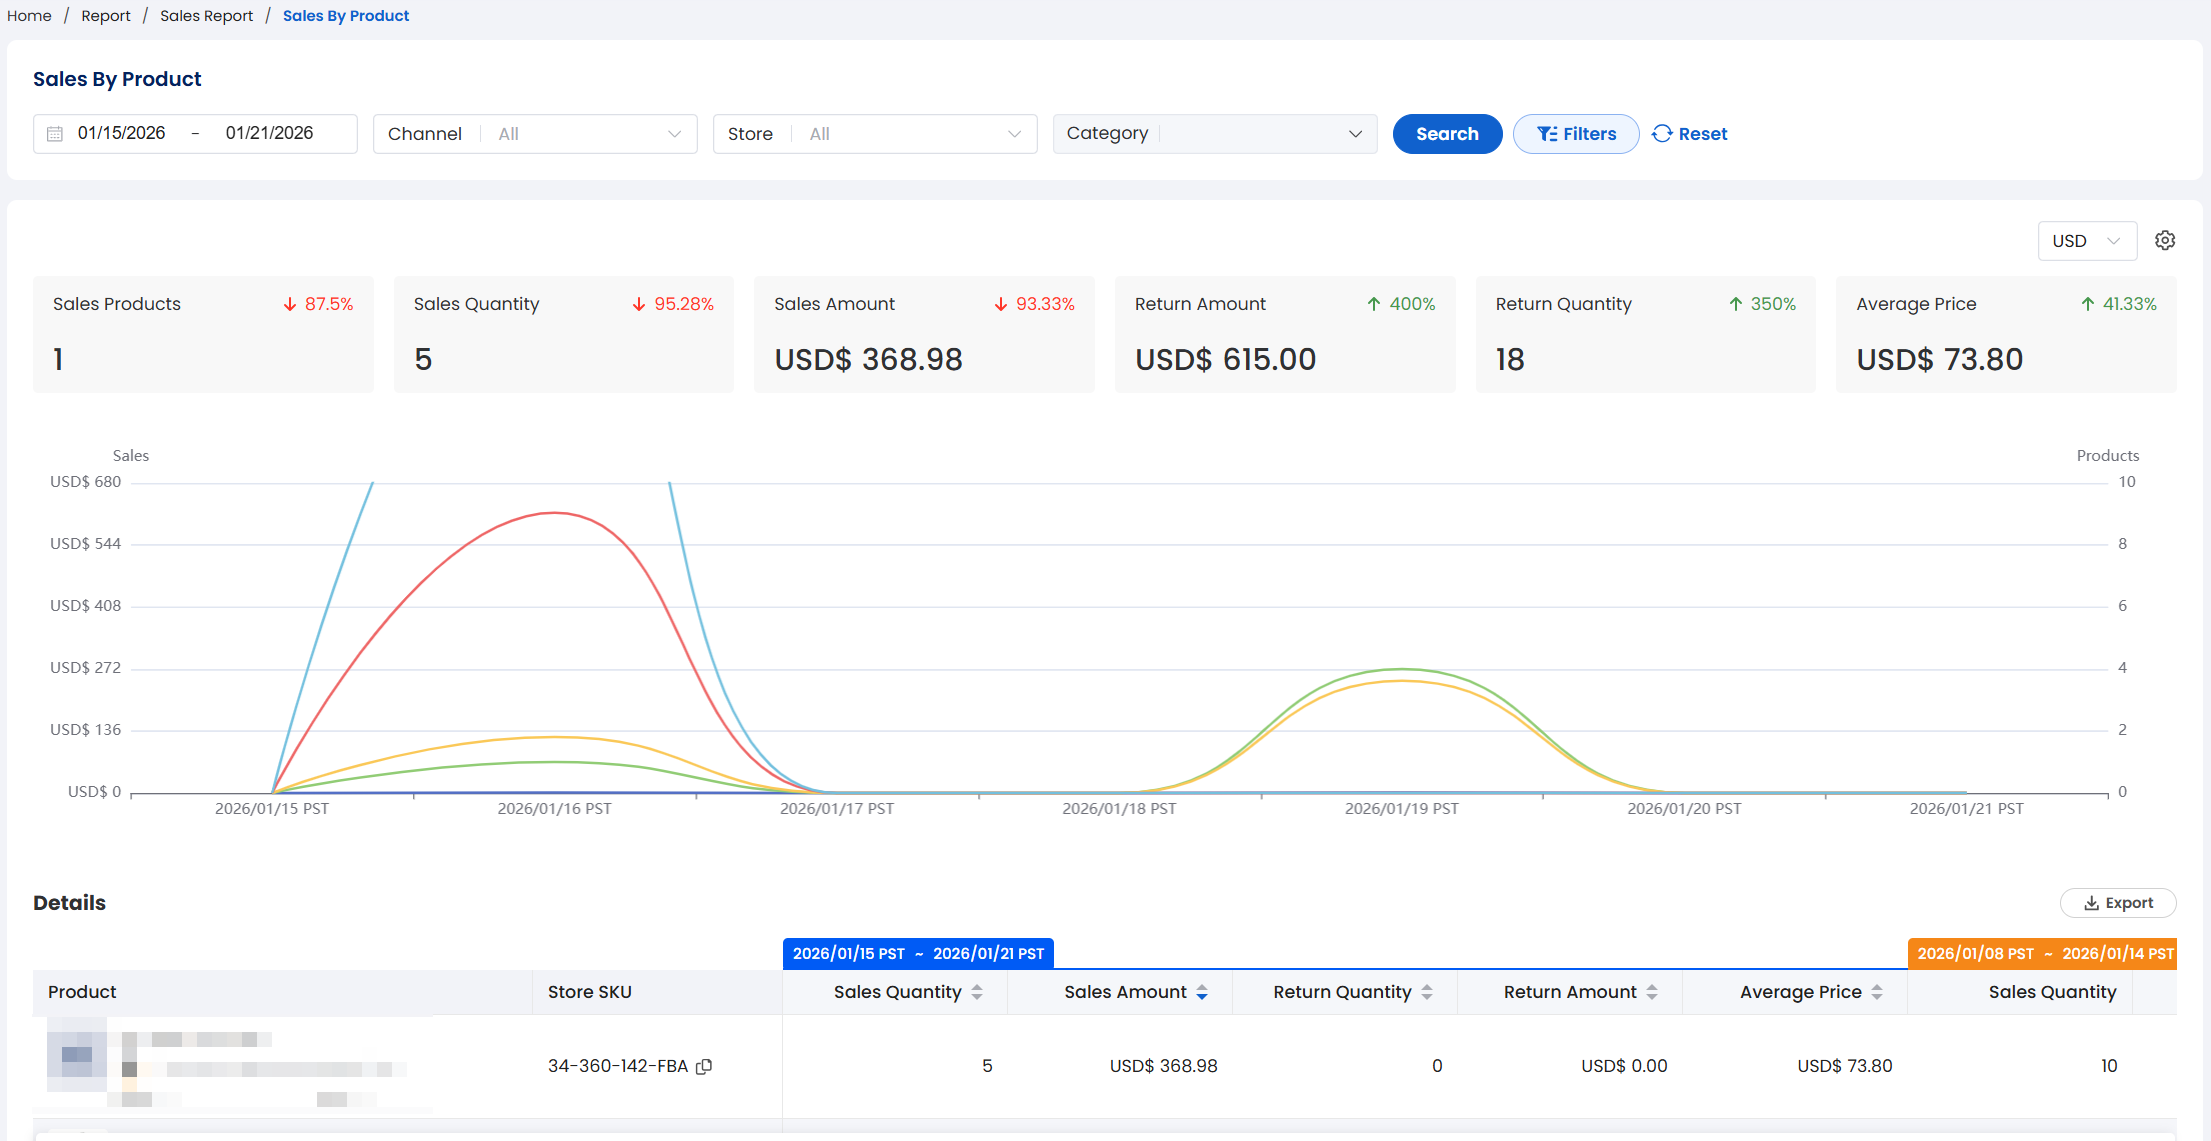
The Product Sales module drills down to the SKU level, revealing the true market performance of every item. It forms the foundation for product selection optimization, inventory management, pricing strategy, and quality improvement decisions.
Key Metrics and Business Value
| Metric | Description |
|---|---|
| Sales Quantity & Sales Amount | Identifies bestsellers, steady performers, and slow-movers; high quantity + high amount = “star products” deserving priority support. |
| Average Price (Sales Amount / Sales Quantity) | Reflects actual transaction price; useful for verifying discount depth or bundled offer effectiveness. |
| After-Sales Quantity & After-Sales Amount | Pinpoints high-risk SKUs; if a product’s return rate (After-Sales Quantity / Sales Quantity) is significantly elevated, immediately investigate or optimize its detail page. |
| Number of Products Sold | Measures catalog breadth and customer choice diversity; too few may limit repeat purchases, while too many may dilute traffic. |
Data Visualization
- Multi-Dimensional Trend Chart: Shows daily trends for number of products sold, sales quantity, sales amount, after-sales quantity, and after-sales amount.
- Purpose: Detect “high-sales but high-after-sales” items (e.g., a spike in sales followed by a surge in returns the next day), enabling timely intervention to protect brand reputation.
Detailed Data Table Fields and Value
| Field | Decision Support Use Case |
|---|---|
| Product Name + Main Image | Quickly identify problematic items |
| Store SKU | Precisely align with inventory and ad units |
| Sales/After-Sales Quantity & Amount | Calculate per-SKU profit margin and return costs |
| Average Price | Benchmark against competitors and refine pricing strategy |
Filter Options
-
Time range, channel, store, category
-
Typical Use Cases:
- Filter “Home” category + last 30 days → Generate a list of high-potential new products for procurement
- Limit to BestBuy channel → Analyze user preferences (e.g., tendency toward higher AOV items)
Integrated Usage Recommendations
| Business Goal | Recommended Analysis Path |
|---|---|
| Evaluate yesterday’s overall performance | Sales Performance → Check net sales, AOV, and after-sales rate for health indicators |
| Optimize multi-store resource allocation | Store Sales → Shut down underperforming stores; increase investment in high-ROI stores |
| Create a restocking plan | Product Sales → Select SKUs with high sales volume and low return rates for replenishment |
| Reduce refund rate | Product Sales → Identify items with >5% return rate; improve detail pages or quality control |
| Validate big promotion impact | Sales Performance (trend chart) + Product Sales → Determine if growth came from across-the-board lift or was driven by a few top sellers |
✅ Pro Tip: The value of data lies not in “seeing” it, but in “acting” on it. We recommend setting 1–2 key questions each week (e.g., “Why is AOV declining?”) and using reports to test hypotheses and close the loop with actionable improvements.